This story was originally published by ecoRI News, a publication partner of Ocean State Stories.
TIVERTON, R.I. — One day when Roger Williams University professor Joel Singley was walking with his young daughter in the Pardon Gray Preserve, he noticed something that perhaps only a scientist with a specialty in hydrology would track.
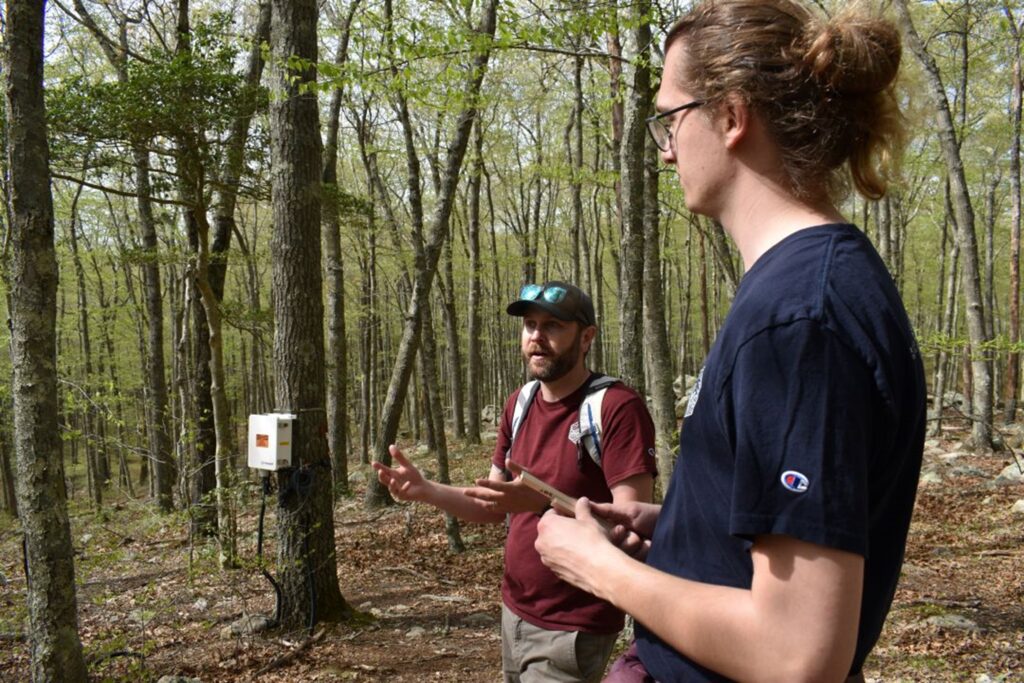
As he followed the preserve’s trail up a forested ridge, he noticed the oaks at the bottom of the ridge were larger and taller than the oaks at the top. A few reasons for this difference came to mind: accessibility to water; the effects of climate stress; changes in the tree canopy from one elevation to another. His interest was immediately piqued, and he shared his thoughts with one of the students in his Limnology course, Sean Costello, who was equally interested. (Limnology is the study of the biological, chemical, and physical features of lakes and other bodies of fresh water.)
“I was struck by the small-scale variations that you’re seeing, the elevation differences and just how different the forest looks” from one area to another, Singley said.
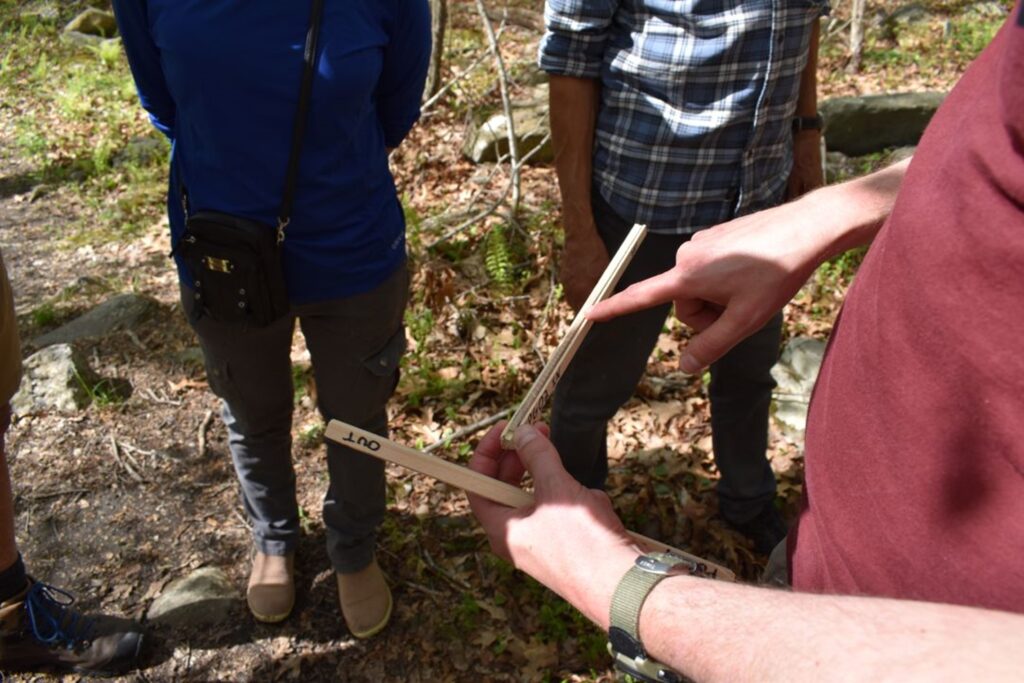
Costello, a senior majoring in environmental science, began by taking core samples of more than 40 trees on the ridge in Pardon Gray Preserve.
“Basically, my project started off with me counting the rings for all the trees, measuring the width and then comparing them across all the trees top to bottom, and trying to see if there’s any sort of patterns in growth,” he said. “And what we found is that there sure are patterns in growth.”
What Costello found when he compared the trees’ cores is that the trees at the bottom of the slope have much wider rings than the trees at the top, even though the oaks are roughly the same age.
Singley, an assistant professor who runs the eponymous Singley Lab at Roger Williams University and specializes in critical zone science, hydrology, biogeochemistry, and geophysics, said their initial thought was “Oh, it’s just simply age, right?” But the core samples taken by Costello showed the trees’ growth increments each year were dramatically different. So then, Singley said, they thought that maybe the trees at different elevations have different sensitivity to climate because of water availability and root depth.
Once again, Singley and Costello were surprised by their discovery. The tree cores showed that some years the trees’ growth was slower, which is commonly related to temperature and the amount of rainfall over the course of a year. They expected to see trees at the bottom of the ridge would show less variation in growth because they most likely had better access to water, which would flow downhill from the top of the ridge.
“So even in a dry year,” Singley said, “they’re going to have a kind of consistent water supply, and that maybe the trees up at the top of the ridge would be much more sensitive and show stronger variation from one year to the next related to those precipitation and temperature patterns.”
As it turned out, that wasn’t the case.
“We couldn’t really find a sort of pattern to explain why there’s this difference in the ring width, and so that kind of led us into trying a whole bunch of different stuff,” Singley said.
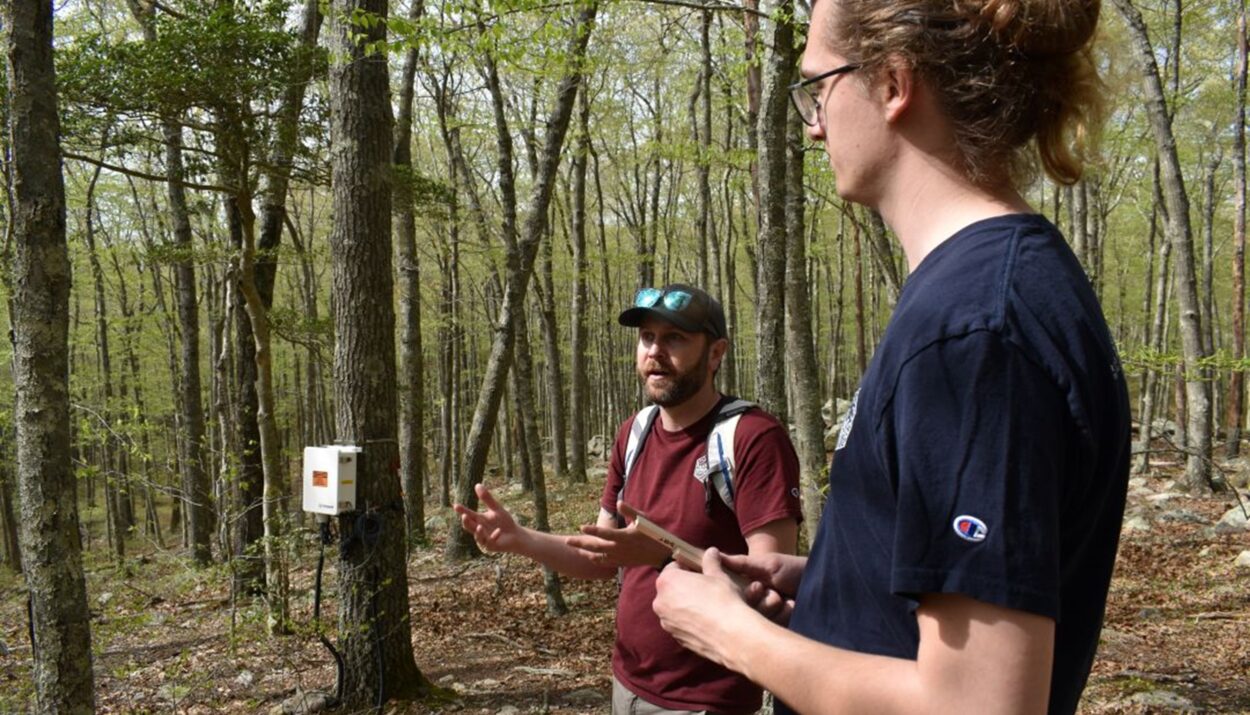
Singley, who received his bachelor’s degree from Cornell University and his master’s and Ph.D. from the University of Colorado at Boulder, had already contacted the Tiverton Land Trust, which owns the Pardon Gray Preserve, to see if it would allow him to install a research-grade meteorology testing station to track weather conditions in a meadow near the woods and on some of the trees in the forest. Trust land management chair Eduardo Rodriguez agreed, and the station was installed last spring.
The met station looks like something you’d see in space, with dials and knobs and weathervanes tracking wind speed and direction sprouting from silver poles, thin wire probes sinking deep into the ground, sensors that measure solar radiation, a stubby “tipping bucket” that measures rainfall, all surrounding a white metal box containing a nest of wires. The met station gathers and stores all that data every 15 minutes, which can then be downloaded into a phone or computer. Singley said he tries to visit about every two weeks.
“I just sit here with the laptop, plug in, download the data to the laptop, and then we’re good to go,” he said. Over time, data provided by the met station will provide a local climate record.
The funds for the equipment came partly from Roger Williams University and partly from a grant from the federal Department of Education for environmental science and engineering equipment.
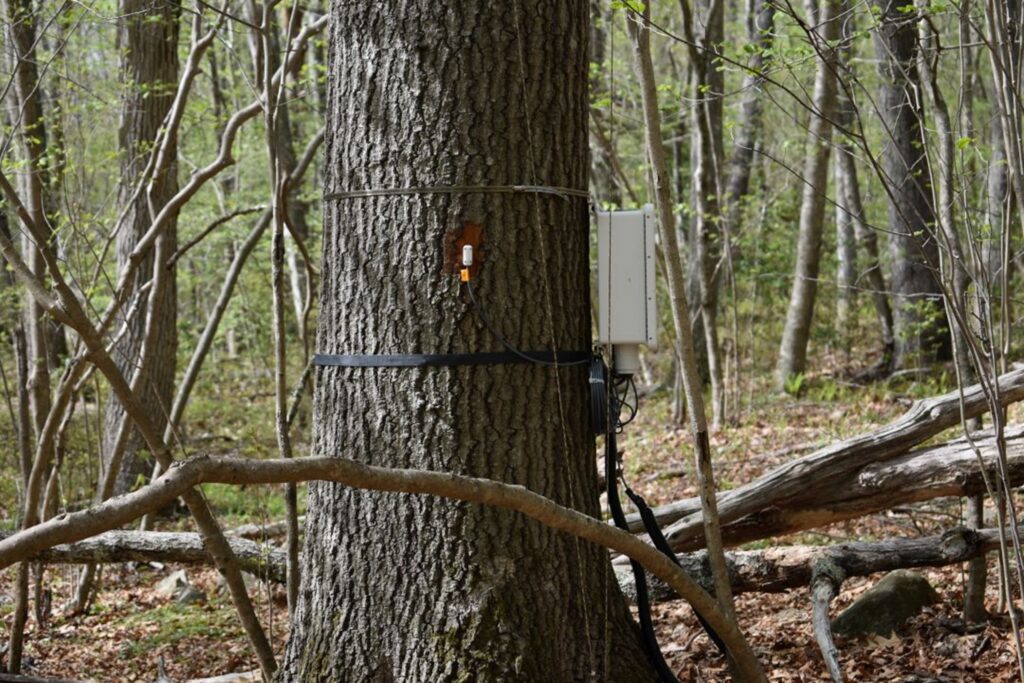
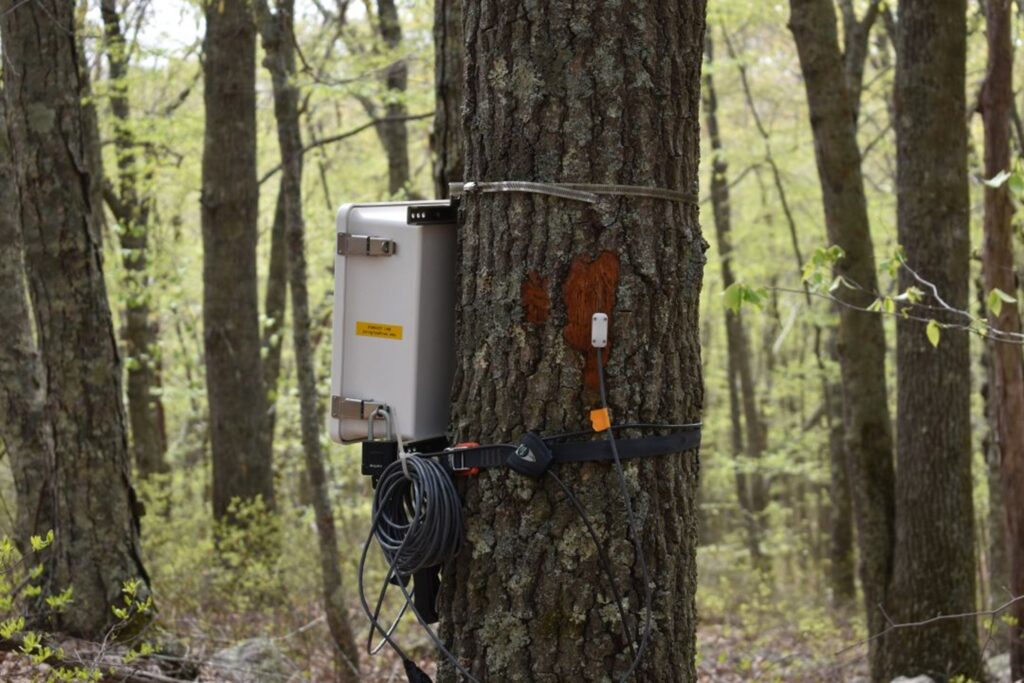
Singley and Costello outfitted two trees at the bottom of the ridge and two trees at the top with sensors and equipment similar to that on the met station in the meadow. They attached sensors that extend into the soil right below the trees, and others that extend needles into the tree which can send heat pulses into the wood to determine how quickly sap is flowing up the tree.
The data, Singley said, allows the scientists to be able to see how the actual moisture availability in the soil changes over the course of the growing season between the sites at the bottom and top of the ridge, and to determine “are the trees using that [moisture] consistently, and are they responding to changes in the weather in the same way we’re expecting them to?”
The roots of a tree anchor the tree in the soil, absorb water and distribute it, and take nutrients and chemicals out of the soil and use them to produce what they need for the tree’s growth, development, and repair. The tree sends water absorbed by the roots through tiny tubes that travel up to the leaves. This allows the tree to send its resources from one area to another. Some tubes, called xylem, mostly carry water from the soil to the leaves. Other tubes, called phloem, mainly carry sugar and other products made in leaves to parts where they are needed.
When the tree is strong and healthy, it makes more than it needs and stores the excess. Then, when the tree is under stress, whether from drought, disease, or pest, it can rely on the stored materials to survive until conditions improve.
Singley noted the trees at the top of the ridge would be expected to deplete the moisture in the soil more quickly than the trees down below, resulting in slower growth spurts. “They’re essentially going to run out of moisture that they can keep pulling [up] until a storm comes through,” he said. “Then, they’ll kind of go bonkers, pull up a lot of that moisture relatively quickly.”
But, he explained, if there’s a longer gap between rainfall, the trees will experience more stress, which in turn results in slower growth.
Another factor in the growth difference, Singley said, is what’s known as a microclimate that surrounds the trees, and he and Costello installed sensors high up in the trees in both areas that can measure temperature and relative humidity released by the trees’ canopy.
The tree canopy at the bottom of the ridge is thicker, resulting in more trapped humidity and more moisture in the soil. Up at the top of the ridge, the canopy is thinner, allowing breezes to blow through and sucking some of the moisture from the soil.
“All of those things would kind of combine [so that] they’re using that smaller amount of moisture that they have available to them much faster,” Singley said. That’s part of what’s unique about the work that Sean’s been doing, and that the lab will continue, is that this is seeing some of those patterns at a much smaller spatial scale than we typically would pay attention to, which raises questions about the resilience of the forest as well.
“Often we would think about this entire forest and its climate resilience, but if we’re seeing such different growth patterns, we’re wondering a little bit more about whether or not that’s an accurate way of looking at it instead of thinking really carefully about this. It isn’t a huge elevation difference, but it might really matter for some of these trees.”
The fact the data disproved some of Singley’s and Costello’s original hypotheses is in itself a vital part of the project, Singley said.
“It’s fun to go through that process of trying to figure out your next steps together, because that’s, I mean, that’s like real science training, right?” he said.
The number and type of sensors on the trees, Singley said, allow for a continuum of information flowing from down in the soil where the roots are, measuring the water that’s there, to the sensors in the trees, measuring water as it flows up the trunk of the tree to the leaves. Plus the microclimate sensors in the canopy itself, measuring the air.
“It’s this continuum from water in the soil, to water in the tree trunk, to water in the atmosphere,” Singley said.
He said his team chose to study oaks because they’re common, and “they like to just kind of gamble for their water use. They don’t down-regulate their transpiration, so they’ll keep letting that water move out of their leaves.”
Singley said he’s very grateful the Tiverton Land Trust had the foresight to allow the met station to be installed, and he hopes it stays in the Pardon Gray Preserve for at least 10 years, accumulating data and allowing him and his students to study and learn from it.
“When you look over the 100-plus-year lifetime of these trees, any difference in their climate sensitivity wasn’t the thing that consistently led to a difference in overall size, right?” he said. “So that wasn’t the best predictor. And so we’re still trying to untangle, like, what is that? What is the thing that allows them to consistently grow differently from each other?”
In the short term, he said, the met station’s data will help Singley and his students understand how and why this particular section of forest in Tiverton grows the way it does, and what potential risks or stressors to the trees there might be.
“If we find out that the trees are tending to be more water stressed during certain times of the year at one site versus another, that raises concerns about additional threats to them,” he said. “Whether it is a climate-related threat or it’s invasive species, anything, when these trees are more stressed, they’re just more vulnerable to any type of impact.”
Singley added such information will be important to the Tiverton Land Trust as well, allowing it to learn about the encroachment of invasive species or diseases in the forest.
Over the long term, he said, the data will provide continuous information about the forest ecosystem.
“When these sensors are generating data every 15 minutes, you can look at and start to understand an ecosystem in a way that’s a lot more complex,” he said. “It’s a much more kind of nuanced understanding of ecosystems and how they respond to their environments and also shape their environments.”
Students in Singley’s classes, whether it’s Earth Systems, Earth & Physical Science for Elementary Educators, Environmental Data Science or Limnology, will also benefit from the project and the data it will provide in the future.
“There’s kind of the broader scientific curiosity, and then there’s that educational and training piece,” he said.
Part of the allure of the Tiverton tree project to Singley is the possibility that they’ll learn something completely new.
“I think the most surprising thing would be, is if water availability has nothing to do with the growth patterns, because at that point, we would have ruled out kind of regional climate variability from one year to next, and then local water availability is kind of the next most logical. And if we get to that, then it’s going to start to it’ll be really kind of confusing to think about which direction we would go in next,” he said.
“I mean, it’s kind of, it is fun in a way, when we find something that totally baffles us.”